Discover G3iD 1.1: Metrics Transforming Global Data
Unlock the potential of Living Metrics through G3iD 1.1. This report reveals how data connects global initiatives and enhances international collaboration.
Digital Geneva·

Unlock the potential of Living Metrics through G3iD 1.1. This report reveals how data connects global initiatives and enhances international collaboration.
Living Metrics captures the digital reach of a specific entity across a range of social media, measuring the quantity and quality of network relationships over time. In Part 2 of this series, we map the diffusion of the Geneva Global Goals Innovation Day @G3InnovDay on Twitter following the event.
OVERVIEW
The Geneva Global Goals Innovation Day (G3iD) was a 1-day co-creation and networking event held in Geneva on 24 March 2017. The purpose of the event, to promote widespread adoption of design-thinking on SDGs, and create a showcase for social innovation, won tremendous public support, locally and internationally. This report is designed to help G3iD participants expand their outreach and identify new, actionable project partners.
KEY FINDINGS
In the days following the event, @G3InnovDay cast 420 Twitter accounts or ‘nodes’ connected through Mentions and Reply links. This is a 44% increase on 291 Twitter nodes from 20 March 2017. The overall growth in volume also had effect on the quality of conversations, with more entities citing specific SDGs. Other indicators remained unchanged from the pre-event reporting:
[vc_icon icon_fontawesome=”fa fa-bullhorn” color=”juicy_pink” size=”xl” align=”right”]
Conversation around 10% of the Influencer nodes comprises 62% of total links
[vc_icon icon_fontawesome=”fa fa-heart-o” color=”juicy_pink” size=”xl” align=”right”]
Citation of specific SDGs increased in conversations, namely SDG no.2, no.13, no.14 and no.17
[vc_icon icon_fontawesome=”fa fa-volume-up” color=”juicy_pink” size=”xl” align=”right”]
#Connect2Effect, The Port Association, Humanitarian Lab, ITC Innovation Lab, and GenevaImpact remain the most active organisations
[vc_icon icon_fontawesome=”fa fa-volume-down” color=”juicy_pink” size=”xl” align=”right”]
Vivian Marcelino joins Paul Bristow and Adriana de Oro as the most active individuals
[vc_icon icon_fontawesome=”fa fa-twitter” color=”juicy_pink” size=”xl” align=”right”]
Diffusion of the official hashtag #G3ID grew by factor x3 in the days after the event
[vc_icon icon_fontawesome=”fa fa-line-chart” color=”juicy_pink” size=”xl” align=”right”]
Several G3iD participants helped amplify the #G3iD hashtag, namely Daniel Dobos, Adam Rogers and WBCSD
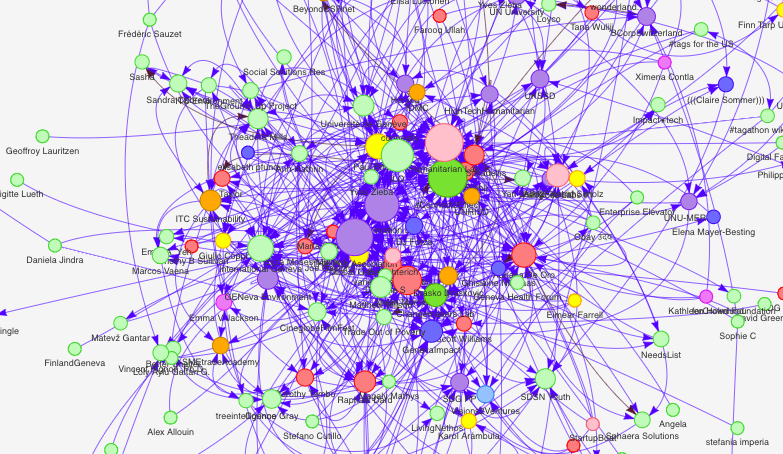
Analysis of the @G3InnovDay post-event network
The post-event network, where 10% of the largest influencer nodes comprise 62% of the total links is almost identical to the pre-event network. Vivian Marcelino, Co-founder of the G3iD network and ITC Consultant, joins the top-10. The main hubs forming the centre of the event network, with the highest frequency of Follow, Mention and Reply links for @G3InnovDay are:
1. Connect2Effect
2. Humanitarian Lab
3. The Port Association
4. ITC Innovation Lab
5. ILO
6. Vivian Marcelino
7. International Geneva
8. Paul Bristow
9. Adriana de Oro
10. Changemaker Lab
Navigate this network by dragging the nodes and open their descriptions by clicking on them.
Data-sets powered by Living Nethos. Click here to access the full G3iD Network Intelligence map for 30-days.
Analysis of the #G3iD post-event network
Diffusion of the hashtag #G3iD is significantly higher when compared to usage of @G3InnovDay across all nodes. For instance, the number of active accounts using #G3iD tripled from 738 Mentions and Replies in the pre-event analysis, reaching 2’448 post-event. The expansion of Influencers beyond the core group also reveals a decentralization of the entire network, at 14% for the #G3iD versus 10% for @G3InnovDay.
Several new Influencers are shown to lead diffusion of the #G3iD hashtag both during and post-event, namely UNITAR, Global Goals UN, and Impact Hub:
1. G3InnovDay
2. ILO
3. The Port Association
4. Humanitarian Lab
5. G3iD
6. UNITAR
7. ITC Innovation Lab
8. Global Goals UN
9. Impact Hub Geneva
10. ITC News
Navigate this network by dragging the nodes and open their descriptions by clicking on them.
Data-sets powered by Living Nethos. Click here to access the full G3iD Network Intelligence map for 30-days.
What are @G3InnovDay followers mentioning post-event?
From the 420 followers of the @G3InnovDay account 2’055 posts appear from the hours prior to the event up to March 29. Of these, 60% of Mentions are about the event itself. For the remainder, 38% refer to SDGs in general terms with 2% referring to a particular SDG. As such, the presence of posts on specific SDGs is richer in the post-event network, where 8 of the 17 SDGs are present.
It is interesting to observe the emergence of a new Influencer in the post-event conversations. Daniel Dobos, CERN physicist and participant of the G3iD event, published 163 posts with a reach of 582 accounts. Of those posts 83% referred to the event itself and 16% to SDGs in general terms.
What are they mentioning besides the #G3ID?
The semantic analysis shows a greater variety of specific hashtags of SDGs in relation to the pre-event network. For example SDG2, SDG6, SDG13 and SDG17 appear in 52% of posts mentioning specific SDGs. Despite this variation, the non-specific hashtag #SDG and the official hashtag of the event #G3iD are the most prevalent mentions for the post-event network.
As with the @G3InnovDay network analysis, several new Influencers emerge from the #G3iD network analysis. Interestingly, Daniel Dobos, Adam Rogers and WBCSD led overall volume of posts as participants of the G3iD event. This is to say entities outside the pool of sponsors and official partners having significant Twitter reach helped amplify the #G3ID hashtag to become a Trending Topic.
1. Daniel Dobos
2. Adam Rogers
3. WBCSD
4. UN
110 Posts = Reach 402
36 Posts = Reach 83
28 Posts = Reach 227
15 Posts = Reach 3’770
Who are the Top Infuencers?
Tables below show the top-10 rankings accounting for three types of Network Influence, namely: Inbound Influence, Outbound Influence, and Delta Influence.
Several organisations are constant in the top-10 for Network Influence, including #Connect2Effect, The Port Association, Humanitarian Lab, ITC Innovation Lab, and GenevaImpact. Aside from organisations, several personal accounts appear within the top-10, with Vivian Marcelino joining Paul Bristow and Adriana de Oro as lead Influencers.
Minor variations appear for each Influencer category, indicating different modes of content sharing.
[vc_line_chart style=”modern” x_values=”Connect2Effect; Humanitarian Lab; The Port Association; ITC Innovation Lab; ILO; Vivian Marcelino; International Geneva; Paul Bristow; Adriana De Oro; Changemakers Lab” values=”%5B%7B%22title%22%3A%22TOTAL%20TWEETS%20W%2F%20MENTION%22%2C%22y_values%22%3A%2254%3B%2044%3B%2061%3B%2053%3B%2027%3B%2041%3B%2025%3B%2040%3B%2031%3B%2031%22%2C%22color%22%3A%22turquoise%22%7D%2C%7B%22title%22%3A%22INBOUND%20TWEETS%20W%2F%20MENTION%22%2C%22y_values%22%3A%2236%3B%2035%3B%2034%3B%2030%3B%2027%3B%2022%3B%2018%3B%2017%3B%2016%3B%2014%22%2C%22color%22%3A%22pink%22%7D%5D” title=”INBOUND INFLUENCE”]
Ordered by Inbound Influence: Ranks the total ‘Inbound’ mentions for each node. May be interpreted as indicator of ‘Credibility’ and ‘Authority’ within this network.
[vc_line_chart style=”modern” x_values=”The Port Association; ITC Innovation Lab; Paul Bristow; Ann-Kathrin; Vivian Marcelino; Connect2Effect; Changemakers Lab; Adriana De Oro; PanglossLabs; Raphael Dard ” values=”%5B%7B%22title%22%3A%22TOTAL%20TWEETS%20W%2F%20MENTION%22%2C%22y_values%22%3A%2261%3B%2053%3B%2040%3B%2024%3B%2041%3B%2054%3B%2031%3B%2031%3B%2026%3B%2024%3B%20%22%2C%22color%22%3A%22turquoise%22%7D%2C%7B%22title%22%3A%22OUTBOUND%20TWEETS%20W%2F%20MENTION%22%2C%22y_values%22%3A%2227%3B%2023%3B%2023%3B%2020%3B%2019%3B%2018%3B%2017%3B%2015%3B%2012%3B%2012%22%2C%22color%22%3A%22pink%22%7D%5D” title=”OUTBOUND INFLUENCE”]
Ordered by Outbound Influence: Ranks the total ‘Outbound’ mentions for each node. Depending on the context this can be understood as an indicator of ‘Spamming’ or high ‘Reachability’.
[vc_line_chart style=”modern” x_values=”ILO; Humanitarian Lab; Connect2Effect; International Geneva; GenevaImpact; Université de Genève; The Port Association; ITC Innovation Lab; SDSN Youth; SDSN ” values=”%5B%7B%22title%22%3A%22TOTAL%20TWEETS%20W%2F%20MENTION%22%2C%22y_values%22%3A%2227%3B%2044%3B%2054%3B%2025%3B%2018%3B%2014%3B%2061%3B%2053%3B%2013%3B%2011%3B%20%22%2C%22color%22%3A%22turquoise%22%7D%2C%7B%22title%22%3A%22DELTA%20INBOUND%2FOUTBOUND%20TWEETS%22%2C%22y_values%22%3A%2227%3B%2026%3B%2018%3B%2011%3B%208%3B%208%3B%207%3B%207%3B%207%3B%207%3B%22%2C%22color%22%3A%22pink%22%7D%5D” title=”DELTA INFLUENCE”]
Ordered by Delta Influence: Measures the balance between ‘Inbound’ and ‘Outbound’ Influence for each node. A high-positive Delta ranking shows strong correlation between volume of Tweets and original content.
Within this category several new entries join the top-10 rankings, namely ILO which seizes the top posiiton, Université de Genève, SDSN and SDSN Youth. While these nodes rank lower for total posts with mentions of @G3InnovDay their strong Delta ranking indicates high volume of original Tweets and low volume of RTs.
The viral cascade of the #G3ID.
From a network intelligence perspective, hashtags are the contemporary memes that help track the propagation of a specific concept, i.e. #G3iD. Hashtag usage also helps visualise the transmission of concepts across networks, like a social virus, via the spreading of Mentions and RTs of the event and the related concepts.
The geographic distribution of the @G3InnovDay followers offers a view of regional hubs, which, if expanded from this base, can migrate over time to reach new territories. As of 29 March 2017, this network showed a high concentration of nodes in Switzerland (48%) followed by United States (14%) and United Kingdom (12%).
[vc_round_chart type=”doughnut” style=”modern” stroke_width=”2″ values=”%5B%7B%22title%22%3A%2248%25%20Switzerland%22%2C%22value%22%3A%2248%22%2C%22color%22%3A%22turquoise%22%7D%2C%7B%22title%22%3A%2214%25%20United%20States%22%2C%22value%22%3A%2214%22%2C%22color%22%3A%22purple%22%2C%22custom_color%22%3A%22%23ebebeb%22%7D%2C%7B%22title%22%3A%2212%25%20United%20Kingdom%22%2C%22value%22%3A%2212%22%2C%22color%22%3A%22juicy-pink%22%2C%22custom_color%22%3A%22%2350485b%22%7D%2C%7B%22title%22%3A%229%25%20Global%22%2C%22value%22%3A%229%22%2C%22color%22%3A%22sandy-brown%22%2C%22custom_color%22%3A%22%23f79468%22%7D%2C%7B%22title%22%3A%225%25%20France%22%2C%22value%22%3A%225%22%2C%22color%22%3A%22blue%22%2C%22custom_color%22%3A%22%2300c1cf%22%7D%2C%7B%22title%22%3A%224%25%20Canada%22%2C%22value%22%3A%224%22%2C%22color%22%3A%22pink%22%7D%2C%7B%22title%22%3A%222%25%20Netherlands%22%2C%22value%22%3A%222%22%2C%22color%22%3A%22purple%22%2C%22custom_color%22%3A%22%234cadc9%22%7D%2C%7B%22title%22%3A%222%25%20South%20Africa%22%2C%22value%22%3A%222%22%2C%22color%22%3A%22green%22%2C%22custom_color%22%3A%22%2300c1cf%22%7D%2C%7B%22title%22%3A%222%25%20Nigeria%22%2C%22value%22%3A%222%22%2C%22color%22%3A%22turquoise%22%2C%22custom_color%22%3A%22%23f7f7f7%22%7D%2C%7B%22title%22%3A%222%25%20Germany%22%2C%22value%22%3A%222%22%2C%22color%22%3A%22pink%22%2C%22custom_color%22%3A%22%23ff9900%22%7D%5D” title=”GEOGRAPHIC DISTRIBUTION OF NODES”]
These proportions are similar to those of the pre-event network however uniform growth is shown across all countries, without privileging any specific country. Percentage increases +2% are noted for France, United Kingdon and United States.
The activity between these accounts was intense, approximately 1’224 links between Mentions and Replies. This activity increases by a factor x3 when compared to the whole month of March, based on 369 links.
CONCLUSIONS
From a network intelligence perspective, the G3iD digital network exhibits behaviours which compliment it’s real-world function, i.e. driving partnerships to accelerate SDGs. Viewed within Twitter, G3iD is an open network which favours horizontal communication and welcomes new entrants to conversation. In the post-event analysis approximately 20 new entities joined the top-100 by Mention of @G3InnovDay in at least 3 Tweets. This implies a community with low-saturation of expertise, where Influencers have no specific monopoly over keywords and concepts. This may also reflect the relative infancy of organised discussion around SDGs, which remains a diffuse concept on Twitter.
With nascent, relatively decentralized networks such as @G3InnovDay core Influencers can have a much stronger impact on the extended network. Part of this responsibility is growing the network and transmitting concepts, for which the G3iD organizers saw clear success. Not only did #G3iD achieve a threefold growth of the hashtag from the pre-event analysis, it was also the leading hashtag in Switzerland on 24 March 2017. Several G3ID participants with high Twitter reach had a clear role in amplifying the #G3iD hashtag and driving conversation around the event.
The strong performance of the #G3iD hashtag compared to @G3InnovDay attests to the importance of effective hashtag communication. It is likely that diffusion of Mentions for @G3InnovDay was highest among organizers and partners, based on deliberate sharing across pre-existing node relationships. Diffusion of the hashtag #G3iD, however, was arguably higher among event participants, based on organic sharing across formative node relationships. Gaining strong diffusion of a specific hashtag is essential to establishing a new brand.
Events on the scale of G3iD, bringing in more than 800 participants, offer a catalyst for conversation and project discovery around SDGs. But foresight is essential for keeping the Influencer network active and indeed the brand alive. The spike in conversation post-event for G3iD points to the value of post-event modules, such as conference reporting, Online discussion or match-making, to maintain the integrity of the Influencer network and help structure ongoing conversation around SDGs. One of the key benefits of network intelligence is knowing how to convert these conversation hubs into active communities that sustain growth over time.
[gravityform id=”4″ title=”false” description=”false” ajax=”true”]